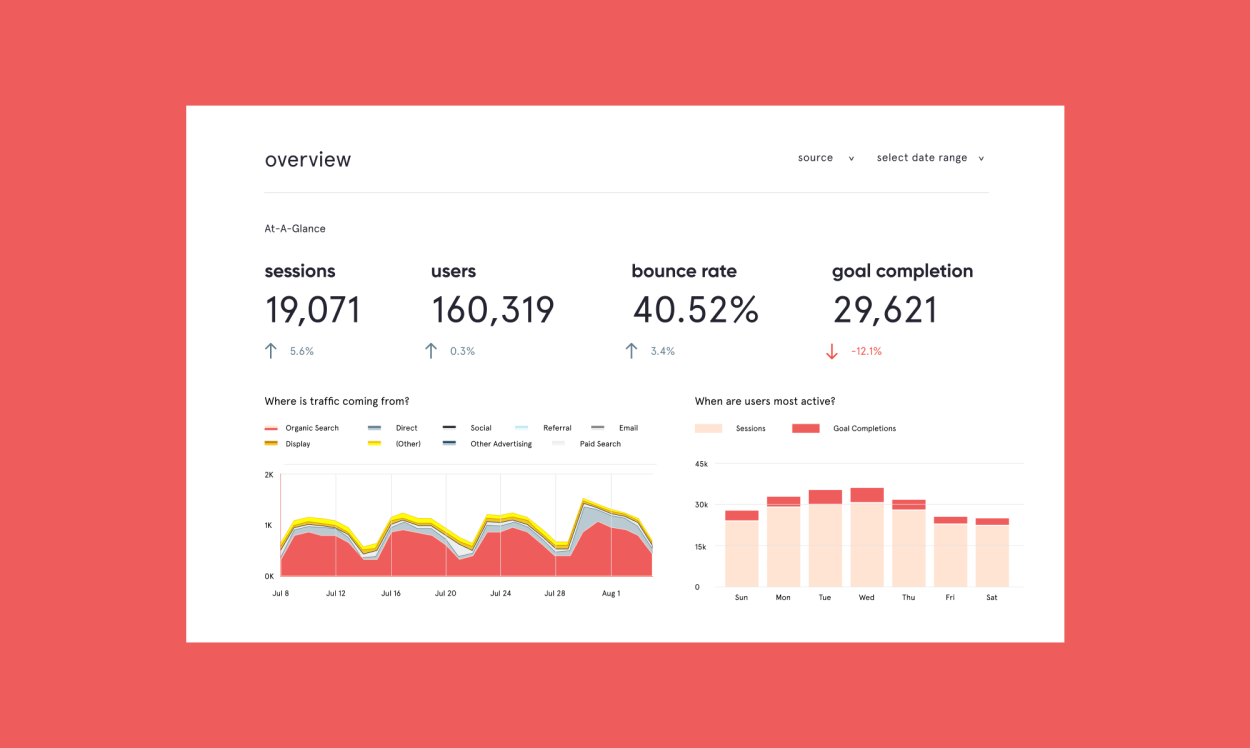
A business intelligence (Bi) dashboard clearly visualises the data you have and categorises it into Key Performance Indexes (KPIs).
It basically translates the raw data you have from your website, social media and internal systems into actionable insights. Here is how you can get one step closer to reaching your business goals by keeping on top of your numbers:
Why should you have a BI dashboard?
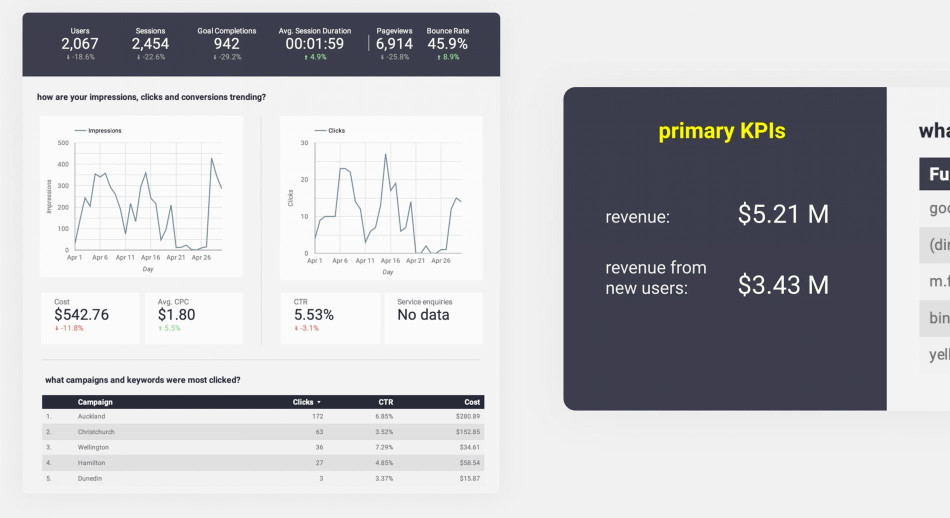
You probably already have some sort of reporting in the individual tools you’re working with - there is Google Analytics, Google Ads Manager, Facebook Insights and revenue reports in your CRM. But what if you combined all of these reports in one place? Wouldn’t that make it easier to see interdependencies and spot potential issues?
A BI dashboard will enable you to make data-driven decisions on the future of your organisation. There are various dashboarding tools that will help you create such a "holy" place where all your data flows together.
How to find the right dashboarding tool?
There are tons of dashboarding tools out there. Some are free, some are "kinda free", and some you have to pay for. Here are some things to take into consideration when researching your perfect Business Intelligence dashboarding software - because there is no one best solution, you should choose based on your needs:
Advanced technology vs usability
While some visual analytics tools have a relatively self-explanatory and usability-focused interface, others (like Google Data Studio or Microsoft Power BI for example) require more tech ‘savvy-ness’.
Using Google Data Studio, for example, is easier if you’ve worked with Google Analytics before and know the relevant metrics and dimensions inside-out.
Klipfolio, another tool, is probably easier to get used to for people that haven’t worked in (digital) marketing before. You can build a dashboard from predefined metric cards (“Klips”). However, with this ‘cookie-cutter approach’, you might hit some boundaries in terms of displaying the exact KPIs and measuring the exact goals that you’ve set for your business.
If you want to go for a more flexible option that exceeds your in-house resources, reach out to the hairyLemon team. Our marketing strategists have plenty of experience in dealing with Google Data Studio.
Integrations
This is probably the most important thing you should keep in mind when looking for analytics software. This includes sources that provide the raw data, like Google Analytics, Facebook or your CRM.
It’s important for your solution of choice to be able to connect to all other systems and software you use. Through that connection, the data on your dashboard can be updated in near real-time.
Some tools, like Google Data Studio and Microsoft BI, also give you the option to manually upload data through Excel files (for example from ERP systems or older CRMs). However, this approach requires a lot of maintenance and can lead to inaccurate or outdated data insights.
Best practices
Break down your goals and key performance metrics
Make it visual and easy to grasp
Find a middle way between detail and top-level
Tailor the dashboard to its main audience
Don’t work your data for better numbers
Get tinkering with your very own dashboard
Dashboards are not set in stone. It’s all about trying out what works best for your organisation and adjusting bit by bit.
We hope this article will help you create your very own flashy business intelligence dashboard.
If you’d rather leave the creation of a business intelligence dashboard to someone else, contact hairyLemon today to discuss ways of working together.